
 News
California Fiscal Issues and Information page
California Fiscal Focus
Summary Analysis of General Fund Cash Receipts (2007 - 2014)
October 2013 Cash Report Summary Analysis
Bottom Line: What the Numbers Mean | Receipts | Disbursements
News
California Fiscal Issues and Information page
California Fiscal Focus
Summary Analysis of General Fund Cash Receipts (2007 - 2014)
October 2013 Cash Report Summary Analysis
Bottom Line: What the Numbers Mean | Receipts | Disbursements
Bottom Line: What the Numbers Mean | Receipts | Disbursements
Published October 10, 2013
 State coffers welcomed a jump in revenues in September that offset shortfalls in the prior two months. With spending holding in line with estimates, California ended the first quarter of its fiscal year on track with estimates contained in the 2013-14 Budget Act.
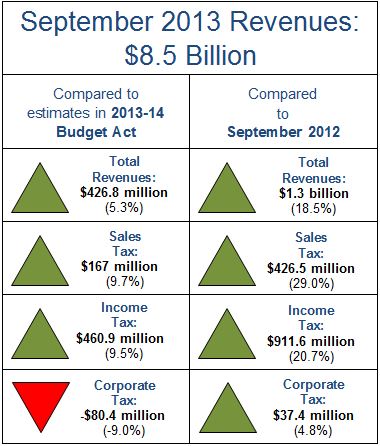
September saw total revenues move past expectations by $427 million, or 5.3%. Personal income taxes, which are California’s dominant revenue source, lurched past monthly projections by 9.5%. Estimated taxes were much larger than anticipated as higher-income households recognized capital gains and other income increases. The surge in stock prices during the first nine months of 2013, with the S&P 500 Composite Stock Price Index up 18%, has been a primary factor driving the favorable performance of personal income taxes.
Retail sales tax receipts also beat budget estimates by close to double digits in September, as California consumers resumed shopping with the support of more jobs, higher home prices, and a rising stock market. Of the three major revenue sources—personal income, retail, and corporate taxes – only the latter fell short of estimates in September. Corporate taxes missed projections by 9.0%, which could reflect some of the slowing in profit growth that has taken place this year.
Looking at the first three months of the fiscal year commencing July 1, 2013, General Fund Revenues totaled $20.2 billion, slightly beating the Budget Act’s $20.1 billion estimate. (See Table 1.) The current fiscal year had begun on the wrong foot, with cumulate revenues falling shy of estimates by more than $300 million in both July and August. September reversed that trend with year-to-date revenues now slightly ahead of estimates by $93.2 million or 0.5%. (See Figure 1.)
On the spending side, although total disbursements exceeded estimates for September, year-to-date figures show expenditures literally matching estimates for the three months combined at $32.7 billion. (See Table 2.) The close match of both revenues and disbursements to estimates means that California ended September with funding requirements as expected.
The state had an outstanding loan balance of $14.7 billion at the end of September. This represented the sum of the $2.4 billion carried from the prior fiscal year and the $12.3 billion year-to-date difference between disbursements and tax receipts. The $12.3 billion spending-revenue gap largely reflects the timing mismatch of expenditures and tax payments at different points over the year. California financed its $14.7 billion loan balance through $9.2 billion of internal borrowing from other state funds and $5.5 billion from external sources, including banks and investors.
California has completed the first leg of the fiscal year with a good pace. Both revenues and state spending have stayed close within their designated lanes, almost exactly matching estimates contained in the 2013-14 Budget Act. Revenue collections could be challenged in the coming months by any negative developments related to jobs, interest rates, stock prices, and home values. Spending will be impacted by demands for education, health care, social services, and other line items. Decisions or a stalemate in Washington related to defense outlays, research funds, Medicare, and other federal programs could ripple back to California in major ways.
Related Reading:
Figure 1: State Revenues Back on Track
Actual Less Budget Estimates, FY 2013-14 Year-to-Date (In Millions)
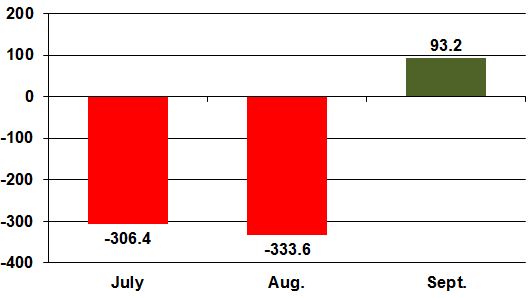
Table 1: General Fund Receipts
July 1, 2013 – September 30, 2013 (in Millions)
|
Revenue Source |
Actual Revenues | 2013-14 Budget Act Estimates | 2013-14 Budget Act Actual Over (Under) | 2012-13 Year-To-Date Actual | 2012-13 Year-To-Date Actual Over (Under) |
|---|---|---|---|---|---|
| Corporation Tax | $1,095.8 | $1,139 | ($43.2) | $1,080 | $15.8 |
| Personal Income Tax | $12,680.3 | $12,549 | $131.3 | $11,361 | $1,319.2 |
| Retail Sales and Use Tax | $5,349.7 | $5,238 | $111.7 | $4,560.7 | $789 |
| Other Revenues | $1,058.4 | $1,165 | ($106.6) | $1,042.4 | $16 |
| Total General Fund Revenue | $20,184.2 | $20,091 | $93.2 | $18,044.2 | $2,140 |
| Non-Revenue | $227.1 | $167.2 | $59.9 | $976 | ($748.9) |
| Total General Fund Receipts | $20,411.3 | $20,258.2 | $153.1 | $19,020.2 | $1,391.1 |
Table 2: General Fund Disbursements
July 1, 2013 – September 30, 2013 (in Millions)
| Recipient | Actual Disbursements | 2013-14 Budget Act Estimates | 2013-14 Budget Act Actual Over (Under) | 2012-13 Year-To-Date Actual | 2012-13 Year-To-Date Actual Over (Under) |
|---|---|---|---|---|---|
| Local Assistance | $27,173.1 | $27,312.7 | ($139.6) | $26,027 | $1,146.1 |
| State Operations | $6,398.7 | $6,466.2 | ($67.5) | $5,534.1 | $864.6 |
| Other | ($840.9) | ($1,056.2) | $215.3 | $189.9 | ($1,030.8) |
| Total Disbursements |
$32,730.9 | $32,722.6 | $8.2 | $31,750.9 | $979.9 |