
 News
California Fiscal Issues and Information page
California Fiscal Focus
Summary Analysis of General Fund Cash Receipts (2007 - 2014)
October 2014 Cash Report Summary Analysis
Bottom Line: What the Numbers Mean | Receipts | Disbursements
News
California Fiscal Issues and Information page
California Fiscal Focus
Summary Analysis of General Fund Cash Receipts (2007 - 2014)
October 2014 Cash Report Summary Analysis
Bottom Line: What the Numbers Mean | Receipts | Disbursements
Bottom Line: What the Numbers Mean | Receipts | Disbursements
Published October 10, 2014
 California's economic growth propelled revenues higher in September, while spending remained in check. The bottom line was that the State made further progress toward restoring its financial health.
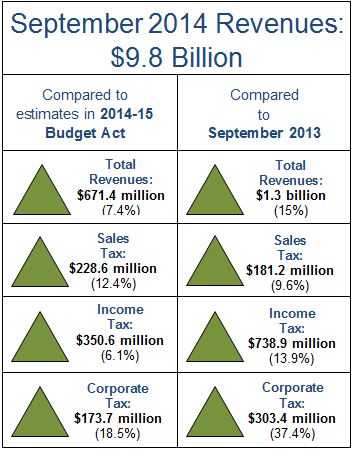
Total revenues in September reached $9.8 billion and beat forecasts contained in the 2014-15 Budget Act by $671 million, or 7.4%. All of the "Big 3" revenue generators -- personal income, corporate income, and retail sales taxes -- surpassed expectations. (See Figure 1.)
Personal income taxes (PIT) in September trumped projections by more than $350 million, or 6.1 percent. Job gains were undoubtedly a key driver of this outcome. California’s nonfarm payrolls expanded by 44,200 in August, which exceeded the number of jobs created in any other state. (See Job Tracker.) Despite wage growth stagnating at about 2 percent per year, expanding employment is fueling a solid upswing in personal income tax revenues.
Despite limited pricing power, corporate profitability is also improving as sales pick up, financing costs remain low, and firms continue to keep a tight rein on expenses. Corporate taxes bested forecasts by almost $175 million, or 18.5 percent, in September. Perhaps the most encouraging message came from the performance of retail sales taxes. While these figures have been lagging recently, back-to-school sales and other purchases boosted tax revenues by nearly $230 million, or 12.4 percent, above expectations for the month.
Total disbursements fell below DOF projections in September by $156 million, or 1.1 percent. For the first three months of Fiscal Year 2014-15, total spending has run $1.7 billion, or 4.4 percent, below estimates. (See Table 2.) This variance is largely associated with payments to local entities and was likely caused by an unforeseen timing change.
Revenue performance for the fiscal year-to-date (i.e., July through September) is also encouraging. Total receipts outstripped forecasts by $645 million, or 3.0 percent. (See Table 1.) When combined with lower-than-anticipated disbursements, the State’s borrowing requirements totaled $13.4 billion, which was $2.4 billion below what had been projected for this time of year. This total was financed by $10.6 billion of borrowing from internal state funds and $2.8 billion of borrowing from banks and other outside investors.
California cannot take its economic and fiscal progress for granted, but September’s results are certainly welcome. The State should continue to take this window of improving revenue flows to address its long-term structural financial issues. These include the need to reserve against future cyclical downturns as well as the need to address the State's sizable debt burden.
Figure 1: September Revenues Outperform
September 2014 Variance From 2014-15 Budget Act (Percent)
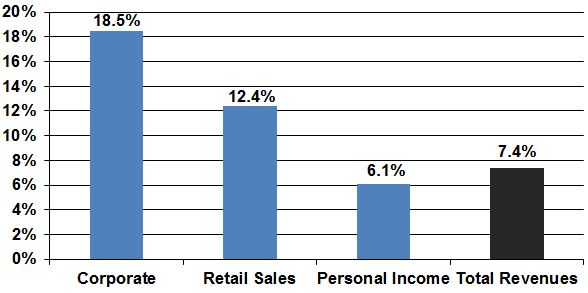
Table 1: General Fund Receipts
July 1, 2014 – September 30, 2014 (in Millions)
|
Revenue Source |
Actual Revenues | 2014-15 Budget Act | 2014-15 Budget Act Over (Under) | 2013-14 Year-To-Date Actual | 2013-14 Year-To-Date Actual Over (Under) |
|---|---|---|---|---|---|
| Corporation Tax | $1,561.5 | $1,132.8 | $428.6 | $1,095.8 | $465.7 |
| Personal Income Tax | $14,059.3 | $13,420.4 | $639 | $12,680.3 | $1,379.1 |
| Retail Sales and Use Tax | $5,255.3 | $5,682.1 | ($426.9) | $5,349.7 | ($94.5) |
| Other Revenues | $938.1 | $1,045.6 | ($107.5) | $1,058.4 | ($120.4) |
| Total General Fund Revenue | $21,814.1 | $21,280.9 | $533.2 | $20,184.2 | $1,629.9 |
| Non-Revenue | $304.4 | $192.4 | $112 | $227.1 | $77.3 |
| Total General Fund Receipts | $22,118.5 | $21,473.3 | $645.2 | $20,411.3 | $1,707.2 |
Table 2: General Fund Disbursements
July 1, 2014 – September 30, 2014 (in Millions)
| Recipient | Actual Disbursements | 2014-15 Budget Act | 2014-15 Budget Act Over (Under) | 2013-14 Year-To-Date Actual | 2013-14 Year-To-Date Actual Over (Under) |
|---|---|---|---|---|---|
| Local Assistance | $26,179.4 | $27,482.6 | ($1,303.2) | $27,173.1 | ($993.7) |
| State Operations | $9,563.9 | $9,498.2 | $65.7 | $6,398.7 | $3,165.2 |
| Other | $1,686.2 | $2,163.7 | ($477.5) | ($840.9) | $2,527.1 |
| Total Disbursements |
$37,429.4 | $39,144.5 | ($1,715) | $32,730.9 | $4,698.6 |