
Bottom Line: What the Numbers Mean | Receipts | Disbursements
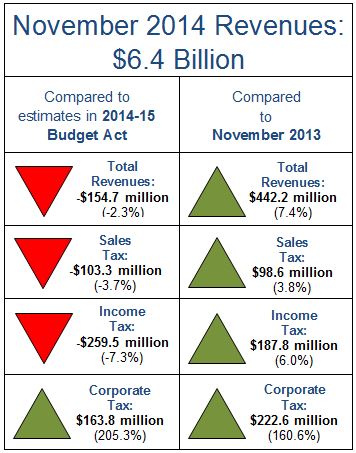
November saw California revenues fall 2.3 percent short of expectations for the month, although the State is still 3.1 percent ahead of forecasts for the fiscal year to date.
Disbursements were also 3.1 percent lower than expected, and remain 2.4 percent behind projections for the first five months of the fiscal year.
Personal income taxes were the major disappointment of November, falling $260 million below estimates. Lower-than-expected paycheck withholding represented the primary shortfall, which is surprising since total national employment grew by 321,000 jobs in that month alone.
Since California accounts for more than 10 percent of all jobs, the State should also post a decent gain when California's job numbers are released in late December. Personal income taxes were up relative to last November by 6.0 percent, or $188 million. Part of November’s shortfall could be due to timing.
Retail sales taxes, which have generally been weak this year, may be a bigger concern. Those taxes fell $103 million behind expectations for the month, and are approximately 6.0 percent behind projections for the fiscal year. In contrast, corporate taxes beat forecasts by $164 million in November.
Looking at the entire period since July 1, total revenues are about $1.0 billion ahead of budget projections, with sizable "overshoots" by corporate and personal income taxes more than offsetting an underperformance in retail sales tax receipts. (See Table 1.)
Disbursements were $237 million less than forecast during the month, with fewer-than-expected dollars going to both State government operations and local assistance. For the fiscal year to date, disbursements are $1.3 billion less than anticipated. (SeeTable 2.) Spending has been less than expected for education, disability services, and other social services but may reflect, at least in part, timing issues.
California typically sees spending exceed revenues during the first several months of the fiscal year, but this year’s gap has been significantly less than projected. Total receipts are more than $1.3 billion ahead of projections, while total disbursements are more than $1.3 billion shy of estimates. As a result, the difference, or the State’s increase in temporary borrowing, is $2.7 billion less than projected. (See Figure 1.) The total outstanding loan balance of $18.5 billion is being financed via $15.7 billion of internal borrowing and $2.8 billion from external sources.
Reflecting on Eight Years of Turbulence
Controller Chiang posted his first monthly cash report shortly after he took office in early 2007. This was a time that preceded the harshest recession since the depression of the 1930s and a period of near collapse in the financial system. California, which had experienced some of the euphoric highs of the housing market, would soon feel the devastating effects of the downturn.
The State’s revenues plummeted from $103 billion in Fiscal Year 2007-08 to a low of $88 billion in the subsequent year, a drop of 15 percent. This was followed by a 19 percent cut in spending, dropping from $107 billion in FY 2007-08 to a low of $87 billion by FY 2009-10.
The post-recession upswing has been equally impressive. For Fiscal Year 2013-14, revenues surpassed their previous high with a total of $104 billion. Many state services, including education, have also seen funding rebound, although at $100 billion, total disbursements are still below their pre-recession high. (See Figure 2.)
California’s economy and tax receipts continue to show solid momentum, but another downturn will likely return at some time in the future. It is therefore important for the State to take advantage of this "window” to address some of its long-term fiscal issues. These large challenges include delayed payments to schools, unfunded retiree health care, indebtedness to other State funds, and deferred spending on critical infrastructure.
Figure 1: State’s Cash Flow Exceeding Budget Act Projections
Billions of dollars, July 1, 2014 - November 30, 2014
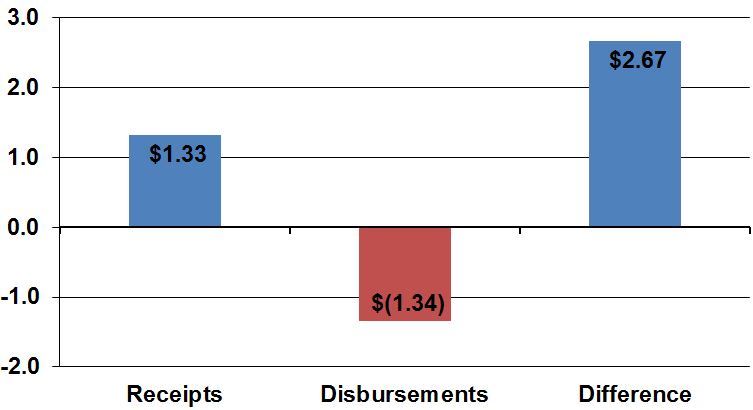
Figure 2: Eight Dramatic Years in California’s Cash Cycle
Fiscal Years, Billions of Dollars
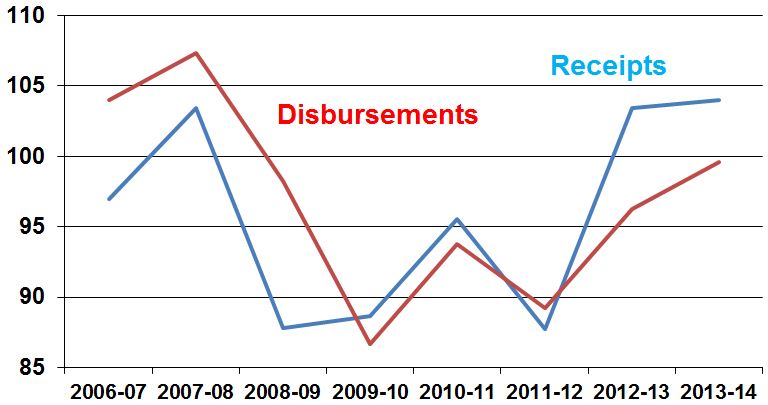
Table 1: General Fund Receipts
July 1, 2014 – November 30, 2014 (in Millions)
| Revenue Source | Actual Revenues | 2014-15 Budget Act | 2014-15 Budget Act Over (Under) | 2013-14 Year-To-Date Actual | 2013-14 Year-To-Date Actual Over (Under) |
|---|---|---|---|---|---|
| Corporation Tax | $1,973.9 | $1,077.9 | $896 | $1,121.2 | $852.6 |
| Personal Income Tax | $22,054.2 | $21,311.2 | $743 | $19,958.3 | $2,095.9 |
| Retail Sales and Use Tax | $8,827.4 | $9,395 | ($567.6) | $8,717.6 | $109.8 |
| Other Revenues | $1,433.4 | $1,464 | ($30.6) | $1,646.9 | ($213.5) |
| Total General Fund Revenue | $34,288.8 | $33,248.1 | $1,040.8 | $31,444.1 | $2,844.7 |
| Non-Revenue | $814.1 | $527.6 | $286.5 | $649.1 | $165 |
| Total General Fund Receipts | $35,102.9 | $33,775.6 | $1,327.3 | $32,093.2 | $3,009.7 |
Table 2: General Fund Disbursements
July 1, 2014 – November 30, 2014 (in Millions)
| Recipient | Actual Disbursements | 2014-15 Budget Act | 2014-15 Budget Act Over (Under) | 2013-14 Year-To-Date Actual | 2013-14 Year-To-Date Actual Over (Under) |
|---|---|---|---|---|---|
| Local Assistance | $38,696.7 | $39,611.7 | ($915) | $38,687.8 | $8.9 |
| State Operations | $14,576.7 | $15,060 | ($483.3) | $11,358.8 | $3,218 |
| Other | $2,258.1 | $2,199.4 | $58.6 | ($828.6) | $3,086.7 |
| Total Disbursements |
$55,531.5 | $56,871.1 | ($1,339.6) | $49,217.9 | $6,313.6 |