A Million New Reasons to Visit Controller’s Data Website
Controller John Chiang’s open data website just got even more interesting.
He recently added more than 1 million fields of fresh pension-related numbers covering Fiscal Years 2002-03 through 2012-13.
That comes in addition to more than 13 million fields of city and county financial data already available on the site, known as ByTheNumbers.sco.ca.gov.
The Controller launched the site in September with the goal of empowering taxpayers by offering up raw data for review and research. The addition of pension information makes this site more powerful and useful.
An easy-to-use interface now lets users get a quick glimpse of data for California’s 130 public defined benefit and defined contribution plans.
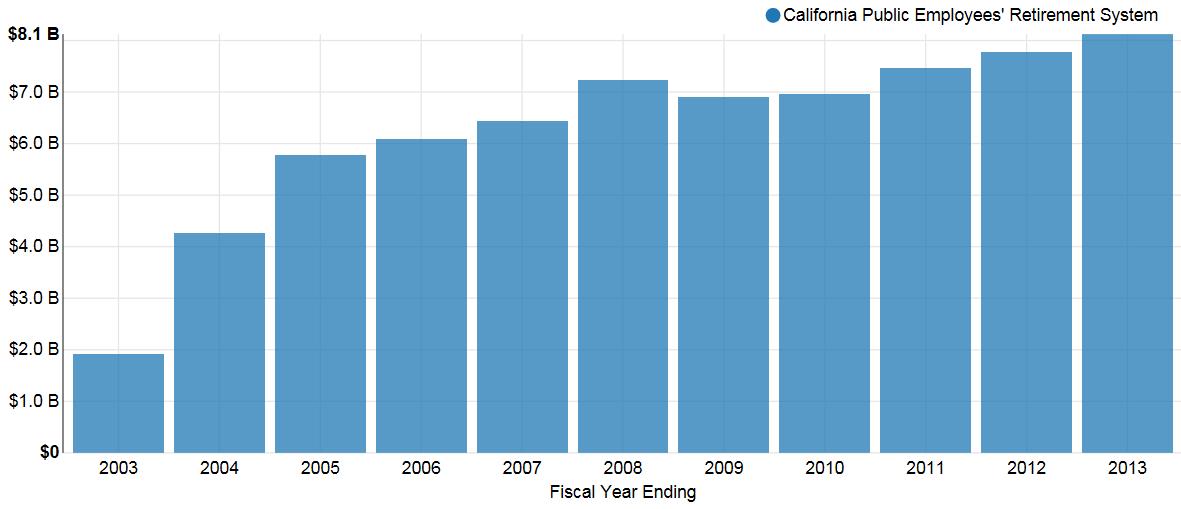
For instance, by using filters on the defined benefits page, visitors can create a chart that shows employer contributions made to the California Public Employees’ Retirement System over an 11-year window:

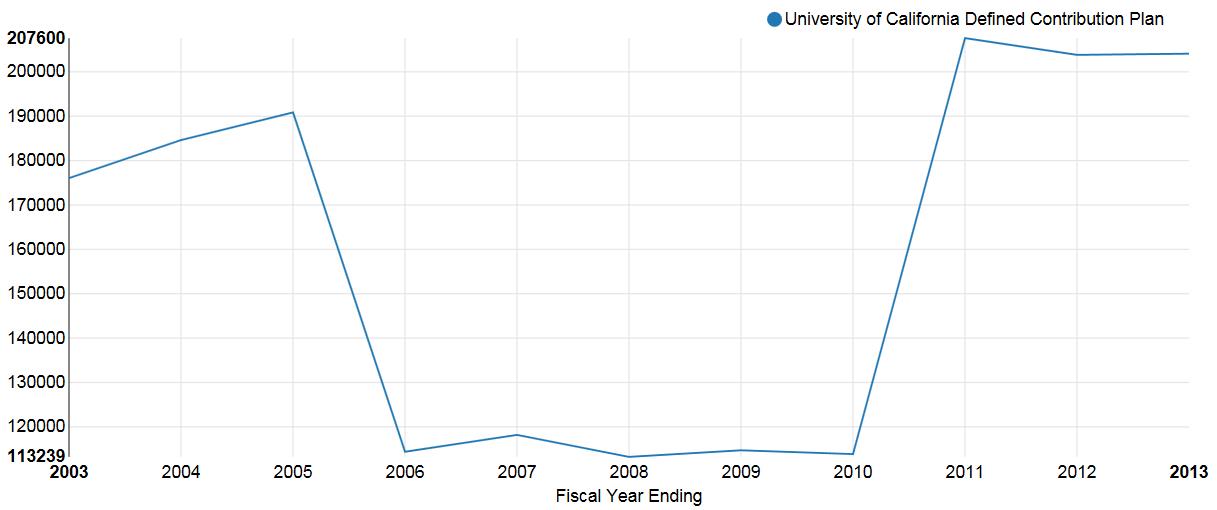
By using filters on the defined contributions page, users can track the number of active members of the University of California Defined Contribution Plan:

Hard core data fans can use more advanced filtering tools to take a deeper dive into datasets.
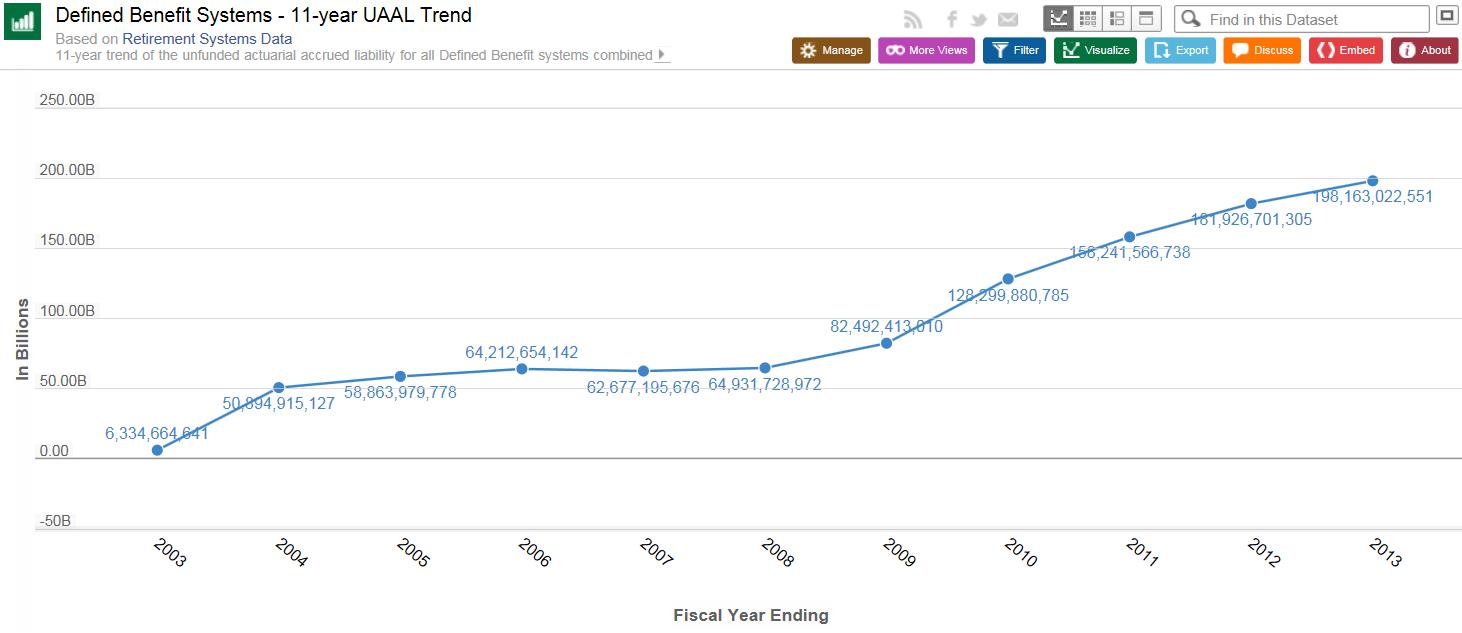
For instance, this trend chart of the unfunded actuarial accrued liability of the state’s pension systems -- or the present value of benefits earned to date that are not covered by current plan assets -- shows it has steadily risen from $6.33 billion in 2003 to $198.16 billion in 2013:

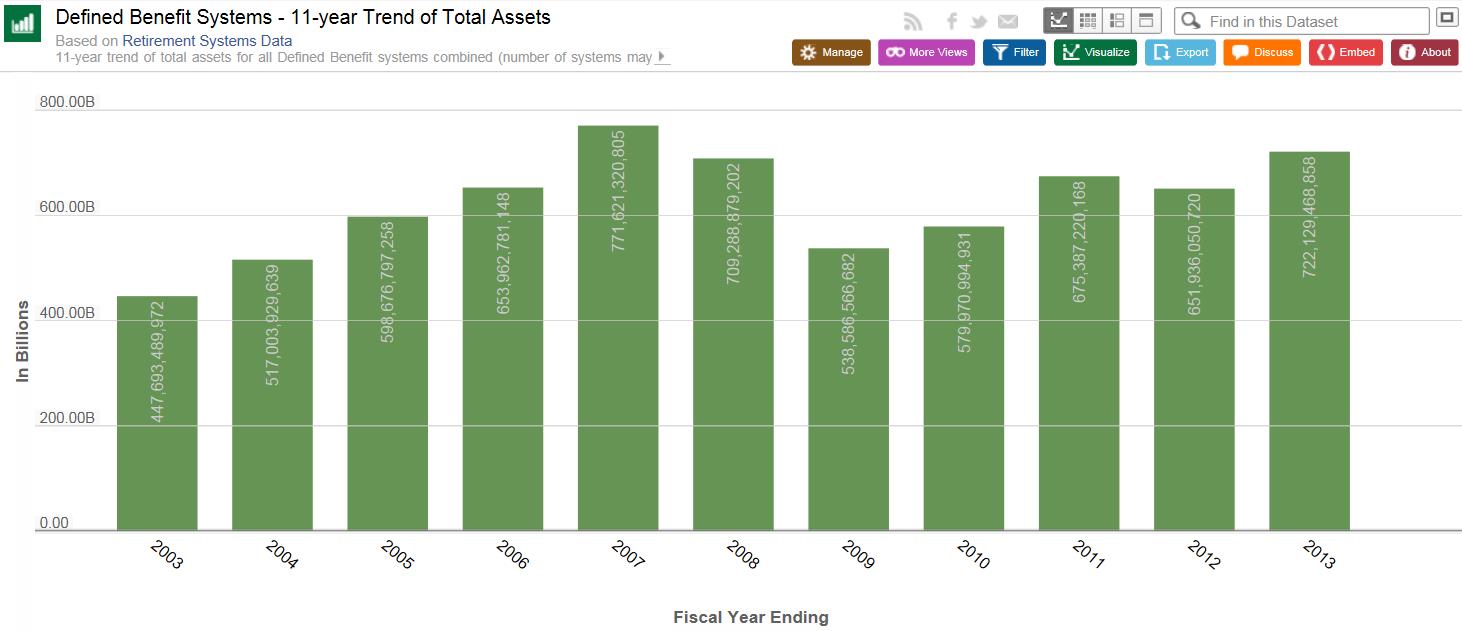
This chart shows the total assets of California’s defined benefit systems were $447.69 billion in 2003, peaking at $771.62 billion in 2007, and were at $722.13 billion in 2013:

To learn more about the site’s advanced tools, watch these tutorials.
What’s next? The Controller plans to add raw data for thousands of special districts by the end of this month. City and county numbers for Fiscal Year 2013-14 are set be posted in December.
We’re looking to make ByTheNumbers.sco.ca.gov your one-stop resource of local government and pension financial data. Please bookmark the site, check it often and give us your feedback. Your valuable input will help us make the site even better.